In Performance Review on
18 March 2011 with 1 comment
Just one year ago, I started trading publicly on this site with an audacious goal: to see if a small, independent thinking investor (err, speculator), could achieve a 100% profit in a single year.
I started on March 19, 2010 with $10,000 in a TD Ameritrade account. Over the course of the year, I completed 25 round-turn trades in stocks, ETFs, and since the start of 2011, options, all of which were documented right here in real time or close to it. Twenty of those trades were profitable. Five resulted in losses. An additional trade is still open (and is a loser as of today).
On the closed trades, my cumulative profit was $11, 239.60. Commissions and related expenses were accounted for at the start of the New Year, so there still need to be some adjustments made, but the bottom line is that with over a 110% gain, the mission is accomplished!
Over the the same time span, the Standard and Poor’s’ 500 index rose 10.3%, so it looks like I’m on to a method that has some potential to say the least.
If you’ve been following (or want to start now), this really isn’t a “method” so much as trying to be opportunistic in recognizing market trends and predilections. Lately I have been working a lot with VIX (volatility index) options, which I think have some good profit potential when market extremes can be identified.
I will be very straight forward and say that I had no real idea at the start whether I could pull off doubling this stake in a single year. Looking back, though, I don’t think that I would have achieved that kind of profit if I didn’t set a goal and and announce it publicly.
I got lucky sometimes during the year: witness January’s Apple options trade that unknowingly co-incided with the announcement of Steve Jobs’ medical leave.
I also got unlucky (and made poor trading decisions), a good example of which is my insistence on shorting Brazil.
I’m not sure if I am going to continue with the double-the-money goal; at some point I’m bound to run out of steam. I do have a couple of ideas for the coming year, however, so stay tuned.
Finally, the whole point about starting on the 19th of March was top honor my beloved grandmother Edith Carlson (1896-2001), who would have had her 115th birthday tomorrow. She put the idea of investing in the markets into my head at a young age, and for that I will always be grateful. If she’s watching this as well, here’s to another great year!

In Trades on
18 March 2011 with no comments
I just finished my first full year of trading on this site by closing out my April VIX put spread on the March expiration day. At the time I took the spread off (a little after 1 PM EDT), the VIX was about 23.75:
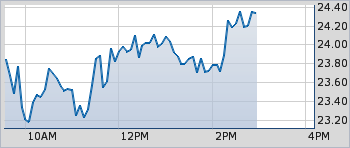
I sold my 10 VIX April $25 puts for $3.60, and bought back the 10 VIX $22.50 puts for $1.75, netting a $300 profit on the trade.
I’ll post up a report on how the first year went a little later.
In Performance Review on
17 March 2011 with 1 comment
Among the emerging nations, Brazil’s performance in the recent market swoon has been impressive. It’s almost a textbook example of relative strength. Take a look at BZQ, which is a leveraged ETF that is double short Brazil:

So when Brazilian market tank BZQ should go up. Its failure to do so in any meaningful way represents my biggest boondoggle since starting this site, with the circled area being my entry point. This position has been one big “ouch” from the start, but I am still hanging there, at least so far!
In Trades on
16 March 2011 with no comments
 The VIX spiked up to 31 at one point today:
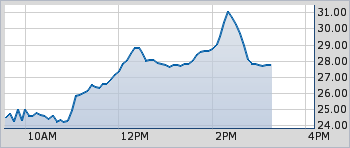
as the stock markets gave up the remainder of their calendar year 2011 gains:
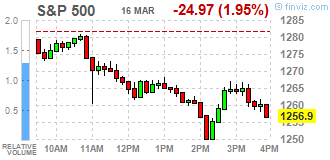
I used this period of turmoil — much of it seemingly rooted in Japan’s nuclear problems following Friday’s earthquake — as the time to switch course yet again, and bet on calmer times ahead, and a drop in the VIX with a put spread.
Specifically, I bought 10 VIX April 25 puts for $3.20 each, and sold 10 VIX April 22.50 puts for $1.65 each. My total cost was $1550, and this bet will pay off best when and if the VIX drops to 22 1/2 before mid-April.
At the time I put the spread on, VIX was 28.62.
In Followup on
16 March 2011 with no comments
I mentioned back in February that Thompson’s insider buy ratio chart is worth looking at if you are in the game of calling market tops and bottoms. And with 20-20 hindsight it does indeed seem that this chart peaked with the February market top:
Now I don’t think corporate execs really had that much to do with the Middle East situation, and they certainly had no advance warning of an earthquake in Japan, but still the February peak looks like good timing to me.
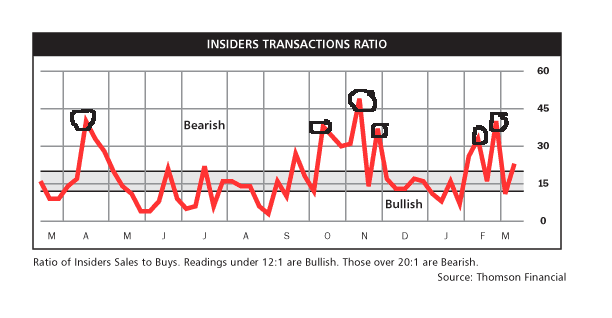
Note that last April’s peak was also a valuable warning. However, the October peak and the second November peak were falso warnings, while the first November peak coincided with a three-week market slide following the election that was erased in December.
In Trading Candidates on
15 March 2011 with no comments
The carnage in Japan’s got you down? Me, too. Not to mention I have to keep nervously watching the VIX, which I need to stay under 25 until Friday, and which is now sitting at 24 and change.
So instead of wallowing, lets take a look at the chart of an old (and sometimes maligned) friend on this site, Green Mountain Coffee:
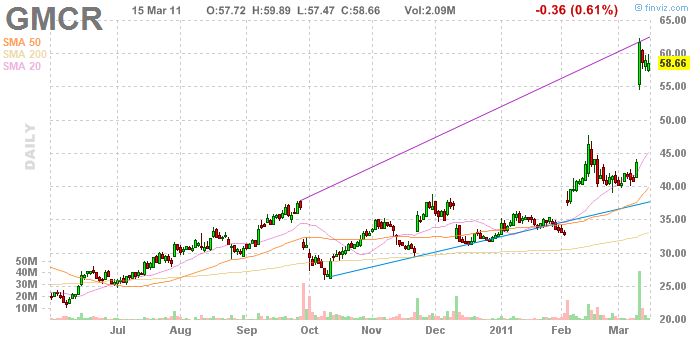
That massive gap of gaps in a stock that is pretty gappy anyway was due to last week’s announcement of a deal with Starbucks to sell SB coffee in single-unit Kuerig doses. Would have loved to have some of those out-of the money $60 calls last week!
Those who gave up on this one in the dark days of last September are surely regretting it now.
Including me!
In Market Recap on
14 March 2011 with no comments
Week 11 of 2011 started off with a little March madness, as the stock market took an early morning dive, and despite a rally attempt in the afternoon:
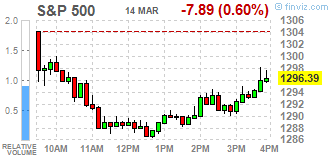
failed to clear the 50 day moving average at 1302:
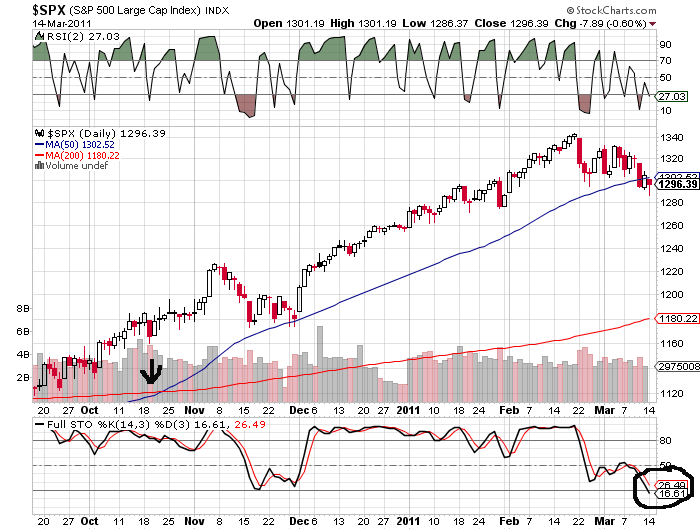
Today makes three trading days in a row that we’ve been below the 50, a line that wasn’t even touched since the week after Thanksgiving. Stochastics are nearing oversold territory, though.
Another interesting thing on that last chart: notice how well folks did who bought the “golden cross” in mid-October. At least so far.
Unless the 50 day MA is reclaimed soon, odds are pretty good that we will see a speedy trip down to the 200 at 1180 — enough to make the bulls say ouch and say it loudly!
As for my friend the VIX (its my friend as long as it stays below 25 until the March expiration):
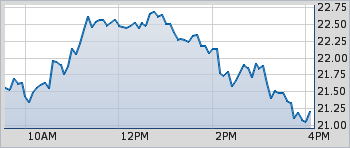
it never moved much above 22 1/2. In future VIX options trading, I think I need to make fewer “out of the money” trades, and stick to strike prices to where the fear index actually trades.
In Market Recap on
12 March 2011 with no comments

A little perspective as the market had a bit of a rough week. Ten weeks in to 2011 and SPY has five green bars and five red ones on its weekly candlestick chart.
The S&P 500 now at 1304 remains up a little over 3 1/2 percent for the year. Not too bad overall, but whether there is more “wall of worry” to climb, or just more worry is what the question really is!
In Trading Candidates on
10 March 2011 with no comments
The mini-cup-with handle formation I noted in Cost Plus has indeed resolved to the upside, again on good earning news:
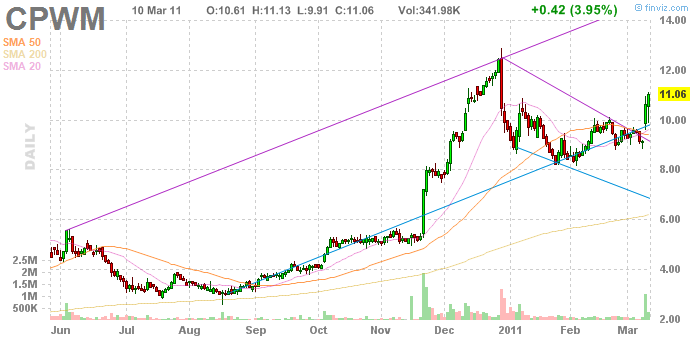
CPWM remains a nice little stock to have in your portfolio for when the economy starts to improve.
In Trades on
10 March 2011 with no comments
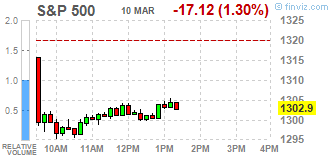
With the S & P 500 descending to 1300 this morning (a level right above its 50 day moving average), and then battling to stay there:
and the VIX temporarily spiking up near 22:
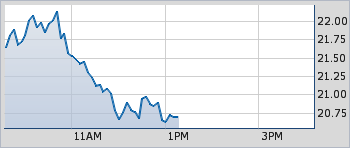
I got what I was looking for and I took the opportunity to close out my open positions in VIX options.
As detailed on the trading log, I sold the April calls for $1.75 and a profit of $170.00, and also sold my May VIX calls for $2.53 and a $215 profit.
Then I switched around and made a bet AGAINST further volitilty: I “went naked” and sold 10 March $25 VIX calls for $0.50 each. If the VIX stays under 25 until March 18th, this should provide another $500 to the balance sheet. Wish me luck with that!


