In Trades on
10 June 2010 with no comments
I got a quick bang for the buck by selling 200 QLD at $56.23 when the exit signal — RSI (5) over 50 — was in place.
I also dumped my grand Canyon Education trade at a loss as it just wasn’t working out. I sold 500 LOPE for $23.72.
Updates later!
In Followup on
10 June 2010 with no comments
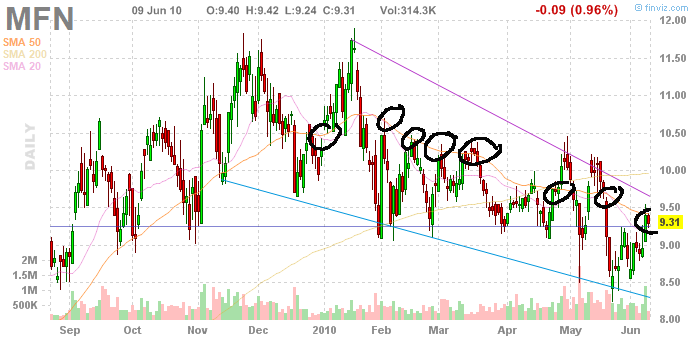 Minefinders (MFN) has now continued it’s pattern of crossing the 50 day moving average on each bounce, as I noted on May 26th.
It didn’t however, make a good short play at $9; gold related stuff proves very tricky to trade!
In Trades on
9 June 2010 with no comments
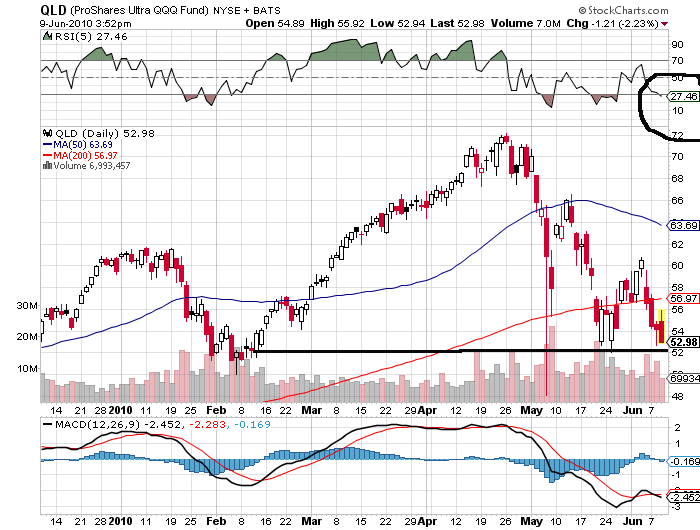 Well, for a short, strange to say I am now fully invested on the long side as my go to trade in QLD fired with a RSI (5) buy signal under 30. I picked up 200 shares at $52.98 just before the close.
Interesting to note that there was no corresponding RSI (2) buy signal in any of the S & P funds, which is unusual.
Bearish as I am, this doesn’t look like a bad pickup, as support hovers just below the purchase point. We shall see.
Lets hope for a bounce, and soon!
In Market Recap on
9 June 2010 with no comments
Weekly updates on the state of the latest downtrend have been posted here lately, along with my own warning to tread lightly on bullish trades until the trendline is broken on a close.
The value of this approach to trading is shown by looking back to the end of the spring rally, and using the same method:
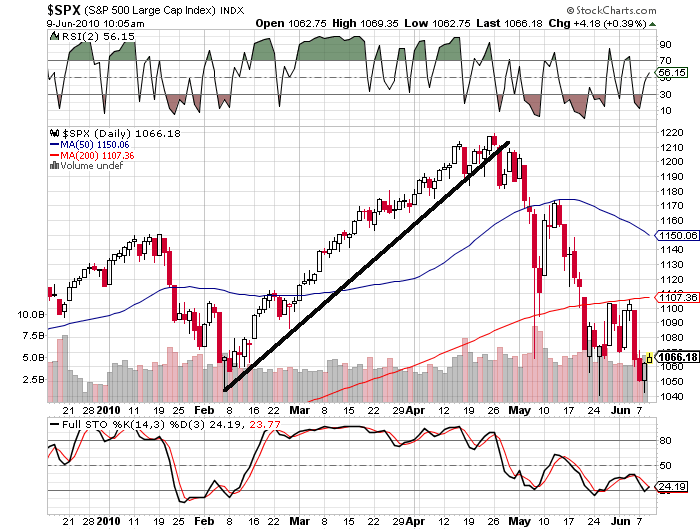
The uptrend line was taken out on the close on April 27th, just one day after the market peaked at 1220. While selling out at the close that day (1182) wouldn’t have seemed like much fun at the time, you would have been smiling retroactively!
Drawing these trendlines and then basing your strategy around them is a very viable means of taming the uncertainty that rules everyday market fluctuations!
In Stock of the Day on
8 June 2010 with no comments
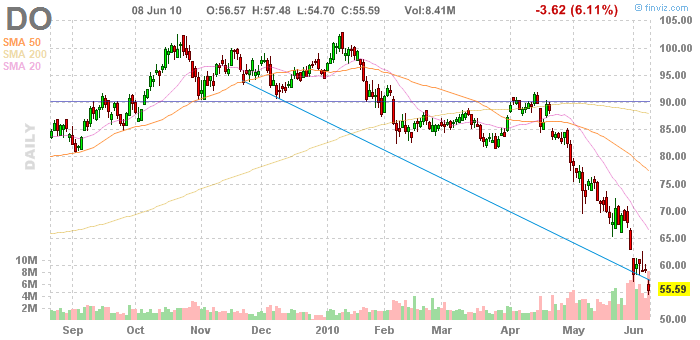 Talk about getting kicked while down — Diamond Offshore gets elevated to CNBC’s stock of the day as Gulf spill failure fills the airwaves, and Goldman piles on with a negative analysis.
DO has an RSI(2) of 3.66 as we speak, but I would never buy something with no support whatsoever underneath it on the chart.
Bounce-hopers, beware!
In Market preview on
8 June 2010 with no comments
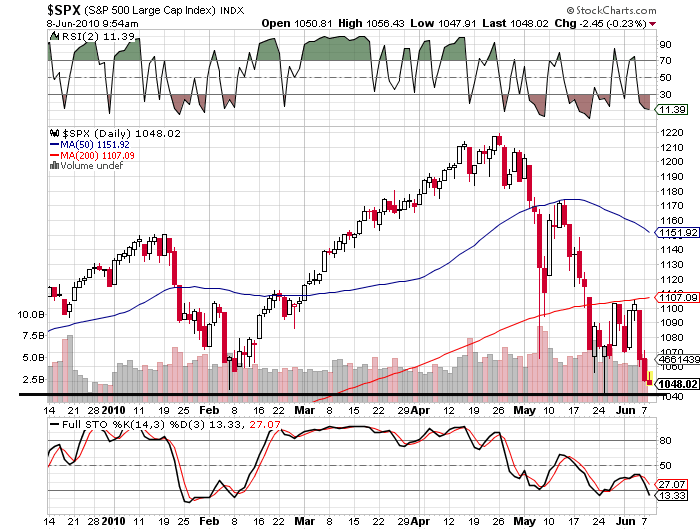 Might we see another test of S&P 1040 as early as this morning?
That was about the intra-day lows on May 25th and Feb. 6th; yesterday represented the lowest actual close (at 1050) in quite a while.
Odds of another test are looking good.
In Trading Candidates on
8 June 2010 with no comments
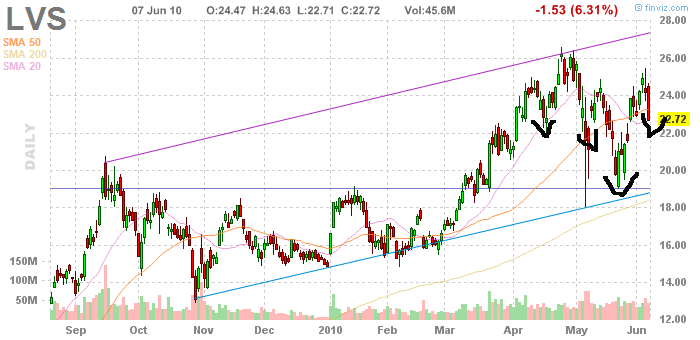 Many think playing the markets is nothing more than a form of gambling; you could choose to push the issue by trading “gaming” stocks such as LVS, which actually has extensive operations and plans in Asia.
Chart-wise, after Monday’s beat-down, we are right in the middle of a wide trading channel, making any move in this stock more of a, errrr, gamble.
Those who want to jump in long will want to see the 50 day moving average quickly reclaimed, and will point to a mini inverted head and shoulders pattern forming since April; if so, this might make a good play on a breakout above $26.
A good stock to put on a watchlist until then.
In Market Recap on
7 June 2010 with 1 comment
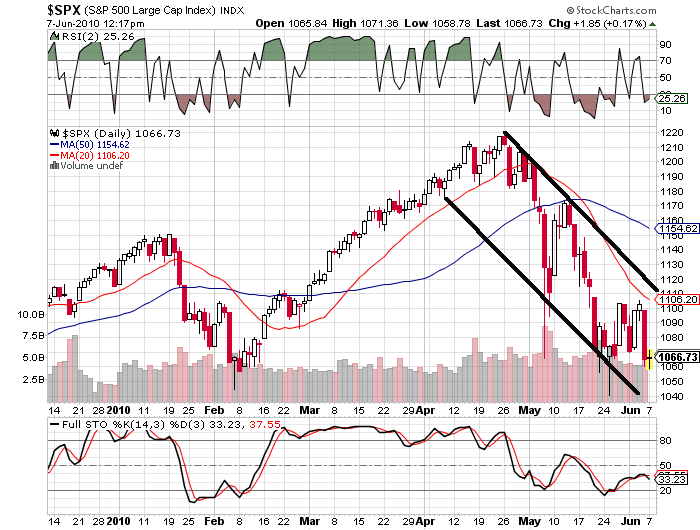 We are now six weeks from the market high when SPX touched 1220 on April 26th. The important levels to watch on any bounce are all coalescing around the same area; the top of the trend channel at around 1110, the 200 day moving average, which has provided strong resistance in the last week is at 1106, and there is a gap at 1115 that could be filled.
On the downside, 1040 looks like the next meaningful number; we may yet see it tested as early as later today. 1040 is both the current lower bounds of the downtrend channel, as well as the intraday low of May 25th.
Be careful with your long trades until this downtrend channel is definitievely beaten!
In Pure speculation! on
7 June 2010 with no comments
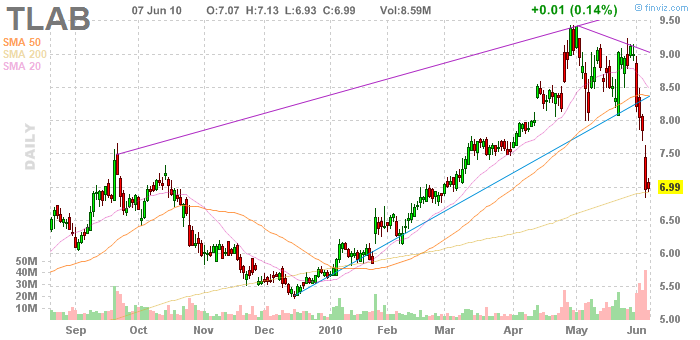 This chart is a good example of why investors shouldn’t fall in love with a stock that has treated them well — the inevitable breakup can be nasty indeed!
A buyer of Tellabs around New Year had plenty to crow about, especially after their earnings report in April — but that gap filled in a single, awful day last Tuesday (June 1) and losing 22% in a week has to be bracing, indeed.
It will be interesting to see if this one can hold at the 200 day moving average, or if it will soon join the ranks of the completely broken.
In Followup on
4 June 2010 with 1 comment
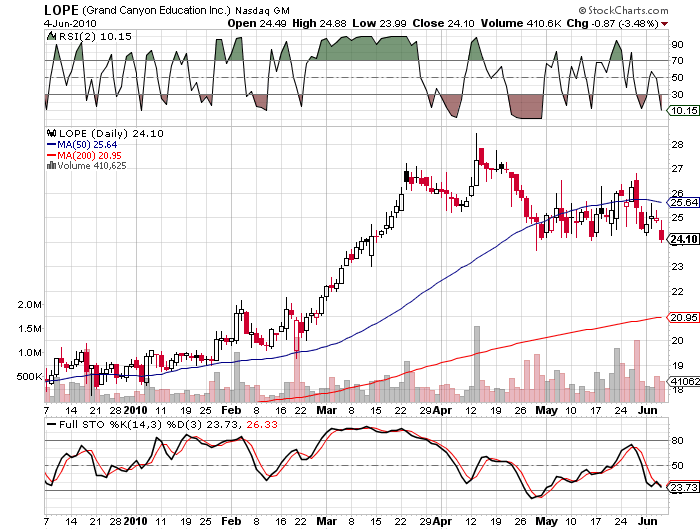 I should have waited until the end of the day to pick up my LOPE — looks like its hanging in there right above long term support at $24.
It was disappointing to see no late session bounce (in this issue or any other) but we can only work with what we have.
Have a great weekend and lets see if a Monday morning bounce will turn the LOPE and CPWM positions profitable. The overall market is not quite completely oversold with RSI (2) at 20; so a dip on Monday to test the recent lows near S & P 500 1040 also has to be prepared for!


