Seeing red as markets go reeling
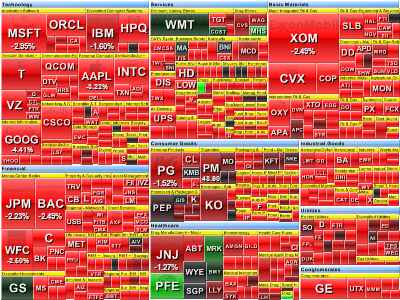
 Well, this is a day that is long overdue in the old equity markets! Just a few minutes before the close, it is certainly looking like a big distribution day. Lets take stock of the damage done:

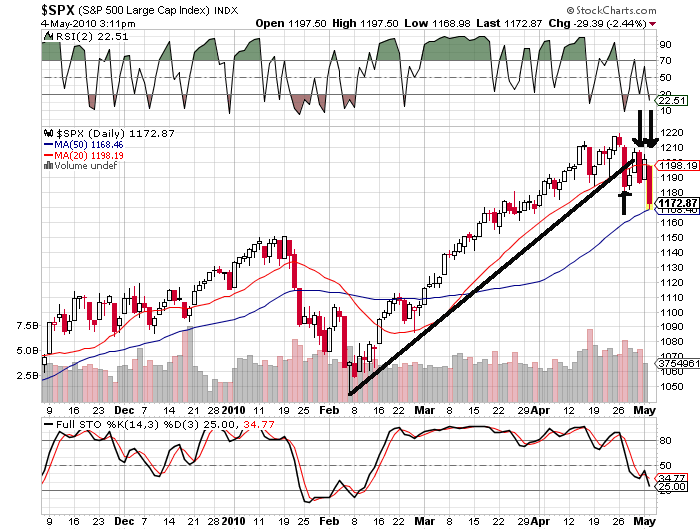
This chart shows the trendline from the February lows (black line) clearly broken, the 20-day SMA (red line) broken as well, although the 50-day SMA (blue line) has held. Noteworthy is that will be the third day in a week that the 20-day hasn’t held (arrows), but the market has rallied to reclaim it the prior two occasions. I would say it is doubtful that it will do this a third time. You will also see above that we are not as oversold on the RSI (2) as we were last week.
Also, peeking at POT isn’t painful today. Looks like the first time since last October it will close below the important 200-day SMA mark:

No Comments Yet