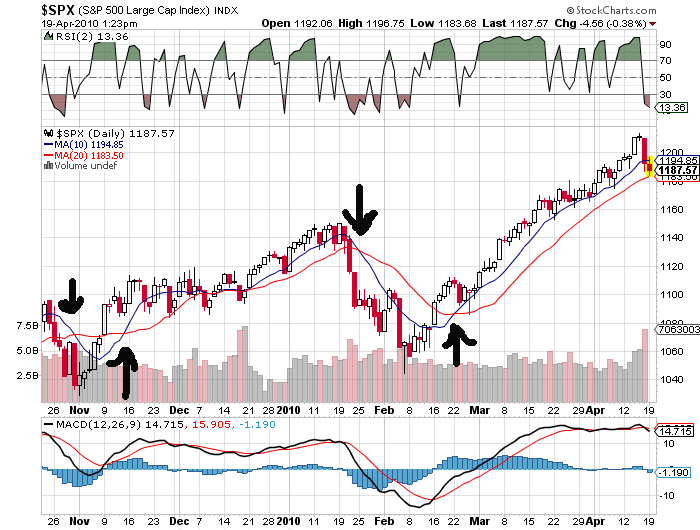
Looking at 10 and 20 day moving average crossovers — ($SPX)
Anyone thinking we might be primed for a substantial leg down on the S&P 500 will find this chart interesting:

We’ve broken through the 10 day moving average, but holding the 20-day as this is written. In 2010, the two crossover points for these moving averages — a sell signal on January 25th and a buy signal on February 22nd — pointed to excellent trades. Not so at the end of 2009, though; the sell signal right before Halloween was an especially big fake-out, and would have led to costly trading errors.
Also of interest is the lack of many discernable gaps during that long grind upwards in March and April; you have to go down to 1125 on March 5th and then to 1080 on February 12th to find a target for filling.
It will be interesting to see if another cross forms in the coming days; in the meantime, be careful out there!
No Comments Yet