Check out this pattern!
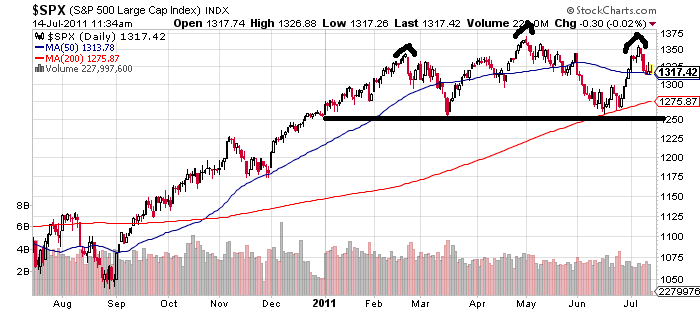
Fans of technical analysis — and especially those who appreciate giant head-and-shoulders patterns — should be salivating over the current one-year S&P 500 chart:

It’s intersting to not that both shoulders and the head have formed within this calendar year, making the remainder 2011 sort of a referendum on whether the pattern will play out. (If you’re new to chart patterns, or infrequently fool with them, H & S potentially portends a large scale drop).
I would say that the market needs to either 1) push to year highs, voiding the pattern; or 2) drop below the “neckline,” which coincidentally is around where we started the year (1258), and then plunge rapidly, or 3) consolidate somewhere within the year’s range (1258-1370) and frustrate everyone for a good long time.
I would also note that large scale, easy-to-see chart patterns on major market averages rarely play out as anticipated. So, unless you’re a riverboat gambler, the only thing we can do is wait and see!
No Comments Yet